On this page:
CCRIF Insurance Policies and Payouts
- Countries can purchase coverage up to US$100 million per peril. Is there a limit on the number of perils covered per year?
Countries buy coverage for a given year up to US$100 million. There is no limit in terms of how many events that a policy can cover. The real issue is the specific amount of coverage purchased relative to the impact of an event on a given country in a given year.
- What is the relationship between CCRIF and other insurance providers in the region –in terms of influencing company policies provided at the national level?
There is no relationship between CCRIF and other insurance companies. CCRIF is a regional insurance fund for the governments and it is specifically targeted at providing business interruption coverage for governments. It is a parametric insurance instrument which is not similar to indemnity type products which are usually offered by the traditional insurance companies. It also operates at a very different level from insurance companies because the CCRIF, as indicated, is a regional institution and it is specifically targeted at governments. Therefore, it does not make coverage available for private companies, etc.
- In light of the fact that CCRIF is a non-profit organisation, what would happen if CCRIF is unable to make payments based on claims made which are more than the amount of funds available if there were events in a number of countries?
The Facility has done an extensive amount of work in order to ensure that it is able to meet the claims-paying requirements necessary for a regional institution like CCRIF. Through pooling of risks between countries and extensive modelling work which is undertaken, CCRIF ensures that the Facility can make payouts or address claims up for a series of events with a less than a 1 in 1,000 chance of occurring in any one year. While 1 in 1,000 is the survivability level that is incorporated into CCRIF’s Operations Manual, currently CCRIF is even more secure than this. This essentially means that there would need to be some massive catastrophes occurring in a number of the large economies across the region: for example Jamaica being hit, as well as Barbados, Trinidad, Cayman and Bahamas within a given year. This is of course a possibility but CCRIF has tried to include or incorporate within the financial aspects of the Facility the ability to actually satisfy those claims. If claims from member governments in any one year exceeded CCRIF’s capital and reinsurance then there are guidelines in place for how that would be dealt with and claims would be paid on a proportional basis until all funds were used up. It should be noted, however, that CCRIF is owned by a Trust of which the effective ultimate beneficiaries are the CCRIF member countries, so it may be that full drawdown of all capital from CCRIF is not considered by the members to be in the best interests of the region.
- What hazards are included in the hurricane payout calculation?
Short answer: Hazards that are included in computing the loss are wind, wave and storm surge in coastal areas where assets can be at risk from wave and storm surge.
The CCRIF payout is based on the loss assessment from the storm as it happens. CCRIF runs the storm track and characteristics in the model after it has impacted the island and computes all loss from wind as well as from wave and storm surge in the coastal areas. That loss estimate then is used in the policy framework to determine if a policy has been triggered or not. Other factors which are included in this policy framework include selection of the attachment and exhaustion points which are also tied to the portion of the risk which countries want to insure. Other considerations include the amount of premium a country has paid. All of these factors are selected and determined by the countries.
- What factors led to a payout of ~US$8.5M dollars to Barbados as compared to US$3.2M for Saint Lucia after Hurricane Tomas?
Although there was some concern expressed about the significantly lower payout received by the Government of Saint Lucia relative to their losses and in comparison to the payout received by the Government of Barbados, it is important to indicate that in the case of Saint Lucia, most of the damage which occurred was a result of the heavy rainfall and secondary induced hazards such as landslides. Neither rainfall nor landslides are included in the current CCRIF Tropical Cyclone coverage and are not included in the pricing provided to countries for coverage. In the CCRIF policies, Hurricane coverage is related to wind, storm surge and wave action. Also of importance is that payouts countries receive are influenced not only by the hazard levels experienced but also the specific policy arrangements. The coverage selections made by the various countries in terms of their attachment and exhaustion points and coverage limits would have played a significant part in determining the payouts which were received. These parameters are selected by countries and define the policies purchased by the respective governments and essentially are key determinants of when a policy is triggered or not and at what level. Due consideration should also be given to the value of assets insured which will have a major impact on the dollar value of damage experienced.
- What is the catastrophic trigger which generates a payout for a hurricane or earthquake?
The trigger level is dependent on the coverage purchased by individual countries. Member governments may purchase coverage which triggers for a ‘one-in-15-year’ hurricane and a ‘one-in-20-year’ earthquake, with maximum coverage of US$100M available for each peril. The cost of coverage is a direct function of the amount of risk being transferred, ensuring no cross-subsidisation of premiums and a level playing field for all participants.
- What is the strength of winds that cause a policy to trigger e.g. cat 1 etc?
This differs from one country to the next as it depends on the coverage purchased by individual countries.
- In reference to Belize with Hurricane Richard of last year, was it due to the policy that they bought, that they did not get a payout from CCRIF?
Yes. Belize did not receive a payout after Hurricane Richard because the modelled losses fell just below the 30-year return period attachment point they had selected for their Hurricane policy. Although the CCRIF loss model generated a substantial government loss in Belize, this loss was below the country’s chosen trigger level so no payout was due. This situation therefore highlighted the role that the policy parameters play in determining the triggering of a payout. The parameters are in turn selections made by the governments in terms of the risk which they wish to transfer.
- Will the CCRIF team be willing to meet with country stakeholder groups to discuss the CCRIF policies in more depth?
Yes. The CCRIF team is willing to meet with the various stakeholder groups in countries to discuss the policies in depth. Over the past couple of years significant effort has been made to build awareness of the Facility in terms of what it is, why it was established, who are its members and details regarding its policies and we therefore welcome greater interaction with countries in this regard.
- There is a perception that the triggers for CCRIF are too onerous. Is there any move to revise these down?
When CCRIF was launched, the idea was for it to address catastrophe risks and not more frequent disaster events, although we understand that these frequent disasters have significant impacts on CCRIF member states. CCRIF was targeted at extreme events that do not occur frequently but when they do can cause severe damage and be extremely debilitating in terms of how a country survives after a disaster. A notable example is the devastating earthquake that occurred in Haiti in 2010, when CCRIF made a payout on that country’s earthquake policy within 14 days after the event.
We recognise that in the Caribbean, smaller events can have significant impacts and that the resilience in these countries is lower than for some more developed countries. CCRIF has taken this into account and has made constructive steps to make its policies more responsive without undermining the Facility’s core purpose. For example, countries can now lower the attachment point (“deductible”) of their policies from a one-in-fifteen year hurricane to a one-in-ten year hurricane. Therefore, governments can now insure against events that occur more frequently.
- It is great to see that action has been taken to insure against rainfall events.
CCRIF has always been committed to addressing the needs of the region and recognised that there was great need for affordable excess rainfall coverage. It has been a technical challenge to get to the point where CCRIF is now able to offer an excess rainfall product to Caribbean countries. We will need to continue to do work to improve and update the excess rainfall product – similarly to the way the Facility is continuously improving the hurricane and earthquake products.
CCRIF Second-Generation Model
- With respect to the storms of last year and in particular Tomas, how did the model outputs compare to what occurred in reality?
The only way to really answer that question is to have very detailed measurements that could confirm what the CCRIF model came up with in terms of modelled wind estimates and so on. After Hurricane Tomas, CCRIF made 3 payouts to Barbados, Saint Lucia and St. Vincent & the Grenadines. Each of those countries had damage; the payouts were in proportion to what they suffered from wind and coastal damage (but NOT rain damage as that is not included in the CCRIF hurricane model at present) and also in proportion to what the countries contracted for. Therefore,that was an indirect confirmation that the CCRIF model was close to what actually happened on the ground. The Facility undertook a review of the performance of the CCRIF model relative to on-the-ground data in each of the affected countries where that data was available. This can be found on the CCRIF website at:
http://www.ccrif.org/publications/verifying-ccrifs-tropical-cyclone-hazard-and-loss-modelling
Generally the model performed well, with the differences between ground measurements and the model estimates being within an acceptable range. However, it is important to remember that models are simply the best estimate of what we believe occurred and often comparisons are difficult because there is very little (if any) ground data available.
- Are losses calculated primarily focused on the built environment? What is the level of significance given to the losses in the natural physical environment?
Losses calculated are primarily focused on the built environment. However, CCRIF has some damage functions for the main crops in countries where agriculture plays a big role and therefore adds to the overall loss. It is important to remember what the CCRIF insurance scheme is designed for: it is designed to help governments overcome a temporary squeeze on their finances immediately after a disaster. They have to clean up, repair critical infrastructure, and help some people who cannot help themselves, all this while government revenue from tourism and exports is reduced. So the loss estimate is designed to give an estimate of what the charge to government accounts can be. The payout is designed to help governments in that short period between the disaster and 3-6 months later when they can get loans or other resources to reconstruct what has been damaged.
- Is tourism included, since tourism is the main industry of many islands which is heavily dependent on environment?
Yes, tourism is included within the loss model. One of the main drains on government accounts after a disaster is the fact that tourism drops or disappears and the government no longer can count on the tourism tax. Since CCRIF models the damage to physical infrastructure, including tourism infrastructure, and since this tourism infrastructure is located on the coastline it will be affected by not only the wind but also the storm surge and wave action; all that is incorporated in the overall damage estimate that is done.
- Are the risks tailored for countries based on individual country hazard assessments?
CCRIF uses the entire history of hurricanes since the 1850s to determine the susceptibility of an island being hit by certain hurricane hazard forces. Islands more to the south like Grenada and St. Vincent are less susceptible than the islands in the main Hurricane Belt like Antigua and Barbuda so their risk level is lower and their premium, comparatively speaking, will be lower because their risk is lower. Thus, every island is assessed as to its own individual risk level and this is the basis for pricing of the insurance product for that island. So there is no cross-subsidisation of premium in the pool.
- Where are the base numbers for population from and what is the accuracy of the system for trials?
The population data is taken from the LandScan[1] data source. The LandScan is a satellite-derived database together with a statistical database which is compiled by several of the US agencies and it provides the total population count by country as well as the distribution of that population over the terrain of the country in each 1 km grid cell. However, the database may not be exactly correct in relation to the latest population count in the country but it is a very good close approximation. The currency of the data depends on when the agencies ask the country to provide that information but it is usually up to date within 1-3 years.
In terms of CCRIF’s storm impact estimates, CCRIF verifies systematically how the estimates stand up once the storm is completed. The Facility verifies how close/far the estimates were. An estimate based on numerical modelling can never be an exact representation of what is going to be observed in a country but CCRIF does check if its wind estimates correspond to the data that come in from the automated systems in the country and if CCRIF’s damage estimates correspond to the estimates made by the agencies in the country and international agencies that go to the specific countries and prepare post-event reports. This will include the damage and loss assessment reports produced by UN-ECLAC, the Caribbean Institute for Meteorology and Hydrology post-event reports (which CCRIF helps to fund) etc and also national reports where they are available.
CCRIF’s hazard estimates as verified over the past years are quite close with the observations made in the countries and observations made by the wind measurement stations and so on. Again, the impact estimates can only be compared to reports as they come in from the countries after every event, providing estimates of the impact in terms of how many houses were destroyed, how many houses were partially destroyed, how many people were affected, what is the total damage to the schools, total damage to the roads. Those estimates are often not consistent even within the same country because different agencies will produce different estimates. It is therefore a very difficult thing to agree on a final damage estimate. Also those country estimates have to be compared with CCRIF’s damage estimate which is done for the CCRIF insurance policy. So over the years, CCRIF systematically compares its damage estimates with those from country reports and from international agency reports and the Facility finds that in general there is an acceptable correspondence between the estimates and the reports. CCRIF recognises that a government wants a specific number which represents the damages and that it is a challenge for disaster managers who have to inform government officials and the political leadership about what happened during a storm event. Our advice is to use as many sources as possible and convey the fact that estimates based on modelling always will be just estimates and cannot really be exact numbers – but that there is also uncertainty associated with numbers from the ground.
On CCRIF’s part, after the passage of every tropical cyclone that affects a member country, the Facility invests significant amounts of time in terms of collecting information to verify the models which it uses and that involves working closely again with partners like CIMH and also the disaster management agencies and some international organisations such as ECLAC who go to affected countries and collect information on the physical impacts and also the social and economic impacts which occur in these countries. CCRIF undertakes an exercise to compare the performance of the model with the on-the-ground information which is collected. There was a report produced by CCRIF in terms of a comparison between the model performance and actual information obtained on the ground as it relates to the major storms that affected countries within the region. This report is available on the CCRIF website (www.ccrif.org ) in the publications section and can be found at:
http://www.ccrif.org/publications/verifying-ccrifs-tropical-cyclone-hazard-and-loss-modelling .
- In terms of impact by the wind, what consideration is given to structure? Are the buildings wooden or concrete?
In the Beaufort scale which is used as a measure for impact, CCRIF uses a generic representation of a structure. It is based more on damage function than structure. For the damage potential layers, the damage functions are based on the damage experienced in the Cayman Islands as a result of Hurricane Ivan to average single family residential structures and this being correlated with specific hazard parameters. It is a hybrid damage function.
- Regarding the system of estimating structural damage based on the work done in the Cayman Islands, there is a concern that the Cayman Islands may not be representative of what obtains in the Eastern Caribbean.
The concern is valid. A well constructed (code) Eastern Caribbean home should do as well as an average Cayman home, but an average Eastern Caribbean home may not perform as well. This means that the RTFS potential damage layer is still useful as we can compare homes from the other territories against the Cayman benchmark.
- If there are more accurate data available for a particular country, could this be incorporated into the model?
Yes and No. Technically yes but the practical feasibility is very complicated. Since the model is global we use global data sources. The LandScan data is about 2 years old and reflects the best efforts of US agencies in collecting this information on countries. Sometimes it is accurate and other times it is slightly inaccurate. CCRIF will be looking to update the data base for the 2012 season. For now CCRIF must stick to the current methodology which utilises international data sources. These are themselves regularly updated based on national reports.
- Given that it is the duty of NMO to forecast localised conditions, has the linear regression equation for storm surge by Conner et al been tested by CIMH or NHC?
No CIMH has not conducted any regression analysis on storm surge. The CIMH has been looking into storm surge modelling but this is something which will be an initiative for the future as we are still in the initial stages.
General Hurricane Forecasting and Storm Advisories
- Do the disaster managers design their action plan from the NHC forecasts and graphics or from the local adaptation of the forecast?
It is assumed that disaster management teams already have their action plan and that it incorporates local adaptation of the forecasts drawing on meteorological office expertise. What CCRIF tries to do is provide the information from the NHC and incorporate the RTFS to support those discussions.
- Is there really such a term as "a good (hurricane) forecaster"?
Good is relative. We expect that we will not get it correct all the time but we should get it right at least 90 – 95% of the time.
- It has been suggested that it is a good idea to plan for a hurricane of a category one more than is forecast, does this mean that we could do our own analysis as forecasters, of tropical depressions and determine if there will be tropical storm effects instead of a depression?
No. Given the errors inherent in forecasting, it is better to make a decision based on one category higher. It is better to be over prepared than under prepared.
- What is the tropical storm cone?
The first thing you will see on the NHC website is the Graphical Tropical Weather Outlook, which is updated every 6 hours. It shows the current status of storm systems and the probability of development of each system. The cone formulates the model tracks, i.e. expected possible positions of tracks for the next 5 days – this is the cone of uncertainty. If a centre line is drawn down the middle of the cone, this is the most probable track for that storm.
- When warnings or watches are issued for a particular territory, does the NHC issue advisories every 3 hours?
NHC issues advisories every 3 hours when a storm is within a certain distance or time period of a territory (48 hours for possible landfall) and not when a warning or watch has been issued. NHC consults with the local/national meteorological offices before watches or warnings are placed on the NHC Bulletin. A watch is issued when a storm is within 48 hours and a warning – which has a higher priority – when a storm is within 36 hours. These times have been changed in the past 2 years.
- Since the advisories are based on observations that are 6 hours old, what are the 3-hour updates based on (besides radar in the case of Belize)?
The advisories are based on the latest available data and are updated every 6 hours. It is not based on data that is 6 hours old. Once the system is within 3 hours, again the latest data is used meaning there is a frequent intake of data and the forecasts are updated more quickly.
New track/intensity information is available via many remotely sensed (GOES/POES and RADAR), high resolution model data (e.g. the Hurricane Weather Research and Forecasting (HWRF) model) and in-situ observation platforms (e.g. ships, buoys, aircraft and traditional surface observing stations).
- What is the difference between a regular advisory and an interim advisory?
Typically NHC issues standard forecast advisories for active tropical cyclones every 6 hours at 0300 UTC, 0900 UTC, 1500 UTC, and 2100 UTC. Special “interim” forecast advisories may be issued at any time when significant changes in the tropical cyclone track/intensity or watch/warning products occur. The interim advisory will have only the significant changes to the regular advisory. The other four advisories from NHC which are issued every 6 hours are not issued with the interim advisory.
- Do the winds extend into the NE quadrant?
Stronger winds are usually observed in the NE and E quadrants of a storm, but the extent of the winds is not limited to the NE-E quadrants. Storms move counter-clockwise and generally move from east to west. These two factors combined result in winds around the storm tending to be stronger in the NE and E quadrants – these are therefore the most dangerous quadrants.
RTFS Operation
- Is any special software required to access the CCRIF data/RTFS?
Only Google Earth is required for the purpose of opening KML files. Google Earth is free software available for download online. Persons should then run the CCRIF RTFS system to obtain information.
- Since the password that was given to us will expire by the time the next hurricane season comes, how do users get a new password or do they have to apply for it?
When a user’s password expires, CCRIF will send an invitation via electronic mail and a registration form to reapply for the upcoming hurricane season. When the user returns the registration form CCRIF will issue you with a new username and password. At this time users are also able to nominate other persons that should have access to the RTFS.
- Is there a list of the meanings of key terms, TAOS, RMSs, MM5 etc?
TAOS - The Arbiter of Storms, which is the model you are looking at now (the TAOS RTFS)
RMSs – Regional Meteorological Services
MM5 – Meso-scale Model 5, this is just the name of the model that CCRIF is using
WRF – Weather Regional Forecast model
- There is a problem with the RTFS data for a particular area. The top half of the fields are being cut off.
The RTFS outputs are made for the CCRIF reporting area which is an area that encompasses all of the CCRIF member countries. This is essentially a box bounded by the following – Latitude 2° and 41°N Longitude 97° and 51° W.
- What organisations determine the 5 locations for which countries can choose to have RTFS focused information?
It is a decision which must come from the countries. What we are encouraging is perhaps the formation of a group ideally made up of people from the disaster management offices and departments, meteorology offices and perhaps other organisations, and for this group to come to a consensus on the 5 key locations in the country. CCRIF cannot identify or dictate what these areas should be. This has to be a process driven by the countries. Again we stress the importance of a collaborative effort in determining what these 5 locations are. Once there is consensus on it, the country should submit to CCRIF the name and location (latitude-longitude) of each point, together with information on why the point was selected and how the hazard estimates for that point will be used in support of preparedness and emergency management.
- The impact forecast seems to be focused on the forecast track without consideration of the “cone of uncertainty”. Is that also taken into consideration?
Yes, the forecast is based on the track because the RTFS uses the NHC track to model the storm. However, it also produces a storm location probability or a “cone of uncertainty” for that track which shows you how likely it is that the storm centre will be located there 6, 12 or 24 hours from now. That is, the cone of uncertainty provides the probability. The probability product available allows users the ability to say, for example, “We are 50% sure that it will be in this domain” (or outside of it); the 75% and 90% probability domains are also provided. That information is within the RTFS so that cone of uncertainty provides the framework in which users have to interpret the impact forecast.
- Is it possible to have a best- vs worst-case scenario built into the forecast?
No, these are not included because, given the uncertainty, it is not possible to determine what is the best or the worst. There is an uncertainty cone and one can say, for example, that the probability that a storm will come over a particular location is going to be 50% or less than 25% or 10%, but that is the only possible option. One could, theoretically, construct a best- and worst-case scenario using historical storms but that is not really relevant when you are faced with an oncoming storm which keeps on moving in terms of intensity and track direction and so on.
- Are the RTFS slides from the course available for download?
Yes, all presentations can be downloaded from the training website. Also all information is available in the manual that accompanies the course.
- Can RTFS provide information on “operational impacts on airports”?
What the RTFS uses to determine the “operational impacts on airports” is the international standards that are published by the aeronautical associations. Airports have international standards that dictate when to scale down or shut down operations as a function of the expected wind speed. RTFS uses these standards to compute the impacts in terms of shut down of airports and close of operations. When there is minor damage, there is no additional shut down of the operation. When there is a shut down the system provides an estimate of when the airport is likely to get back up and running.
- Can you explain the fact that when the event comes closer to land the forecast error is smaller?
When a forecast gets closer to land the forecast error becomes smaller. When a storm is 2 or 3 days out the range of possible tracks is quite broad but this narrows when the storm centre gets closer to land as there is less distance for the storm to travel and its impacts begin to be felt.
- Where on the CIMH website can we view these interpretations of Tropical Cyclone forecasts and related observations?
The CIMH interpretation of the forecasts is not provided on the website. This interpretation is given directly to CDEMA via a power point presentation or briefing or in some other format. This is done when a system is approaching or threatening one of the participating countries.
- Does the probability cone as given by NHC consider feeder band effects or only the centre of the system? In the past, even though storms and hurricanes have not affected Trinidad directly we have suffered from feeder band effects especially in terms of rough seas.
Many storms generate what is known as spiral bands, which are simply lines of low level confluencing winds which then produce strong convection or thunderstorms. The weather in these confluence bands can be just as dangerous and pack storm-force wind gusts, heavy rainfall and associated lightning. In the Caribbean, a high percentage of the destruction from storms occurs due to spiral bands, sometime way ahead or even after the storm. Examples would be Tomas 2010 and its impact on Trinidad which was affected by a spiral band a day after the storm passed; and Dean 2007, and associated heavy fall in a trailing band which caused havoc over Barbados and St. Vincent. The possibility of spiral bands is addressed in what is termed the storm environment in the briefings provided to CDEMA etc.
The concerns about spiral band impacts are therefore valid. Unfortunately the RTFS only simulates tropical cyclone systems for which the NHC issues advisories. The NHC does not issue advisories for these associated spiral bands. In these instances the expertise of the regional forecasters will have to come into play in warning of the impacts associated with the spiral bands
COMMENT: Just a reminder that all that the criteria for issuing watches and warnings were increased by 12 hours effective 2010.
COMMENT from JMcDonald: In relation to change in criteria for watches and warnings – while there has been a regional decision to increase the time, within the national context it is still the meteorological office or disaster office which has that authority. It is still very much a national decision.
It is important to underscore that collaboration and cooperation occurs among the NHC and national meteorological services. Before any country is put under a watch or warning there has to be communication between NHC and national offices and it has to be approved. Even in terms of impact on countries, these will always be the responsibility of the national meteorological office or appropriate agencies as they alone have the localised information to warn their populations.
It is therefore the role of the national offices and not NHC to provide the national perspective. Responsibility lies with the local authorities and meteorological services and the RTFS is then used to supplement the information produced by the NHC.
- Can users run historical storm tracks?
Yes. Post event runs will be made available for Tomas, Ike and Richard. These runs will be made available through the training site as well as through the RTFS secure area of the CCRIF website. They will be placed in an area called “Storm Archive.” Users can examine each of the storms and review the storm footprints, hazard layers etc as well as zoom into the maps to get a sense of the granularity of the tool as it relates to impact forecasts.
- Does the RTFS monitor low pressure systems like the one that is in the north-west Caribbean?
This is important because some of these systems produce more activity than tropical systems and also cause more damage. Currently, the RTFS begins to pick up a tropical system when it becomes a tropical depression. KAC begins to track a system once it has been assigned an invest number by the National Hurricane Center (NHC). At CCRIF’s request, KAC can provide the data to the RTFS for a system at this stage – before it becomes a tropical depression. This would increase the data storage requirements of the RTFS. If meteorology and disaster management officers in the region are interested in the RTFS having this capability, they should send a request to CCRIF and CCRIF will consider it.
- What is the difference between the storm labelled AL922013 and a tropical depression identified by the National Hurricane Center (NHC)?
NHC gives each “invest” or weather system of interest a unique code name. For the system “AL922013”:
- “AL” means Atlantic
- “92” is the system identifier for this invest
- “2013” is the year
This code name can be used to locate any specific storm in the RTFS storm archive for later analysis.
- Can the RTFS be updated with data from NHC more frequently – say every 5 minutes?
Yes. The system has been modified so that the RTFS is updated with data from the National Hurricane Center every 5 minutes. (August 2013)
RTFS Outputs
- What is the difference between CCRIF RTFS and other websites such as Ralph Tropical Weather Outlook and stormpulse.com?
Ralph’s Tropical Weather is a site that displays the NHC Tropical Weather Outlook and Advisory information. StormPulse is a general weather site that also has a Tropical Weather Outlook page. This page shows NHC information and integrates it with storm information from other public weather sources.
Both sites show ‘invest areas,’ and provide the user with access to track information from past storms. Both sites re-package NHC information in a more user-friendly and visually attractive way. Since they limit their information to what is produced by NHC, they do not cover any of the impact forecast information provided by RTFS.
- Given that the model outputs are every 3 and/or 6 hours, what kind of lead time is required for the new product – in terms of location specific outputs for a particular island?
First a clarification, RTFS is updated every 6 hours - a 3-hourly update is only done when a storm approaches the US coastline and there has been a major shift since the last 3 hours. The 6-hourly updates are the standard.
The RTFS updates everything every 6 hours. That includes the wind estimates for particular locations. Therefore, every 6 hours the RTFS provides a brand new set of information which covers the same topics as the previous set but now with updated storm information.
In terms of the lead time, most of that is on the NHC side. NHC issues its forecast to the public 3 hours after it (and all the other meteorological agencies feeding model outputs into NHC) has initialised its various forecast models. For example, if a model run was initiated at midnight, NHC will get the results of that model run (the forecast track and characteristics of the storm) around 2:15 a.m. then it will be 30 to 45 minutes to integrate the various model results and prepare the public outputs, which are released at or a little before 3:00 a.m. The RTFS ingests the NHC forecast as soon as it is released by NHC (which is usually a little before it appears on the NHC web site) and the RTFS runs take about 20-30 minutes, and new results are uploaded immediately.
- At what point when the weather system is out in the Atlantic, is the model first run? Will the model use information for tropical depressions or just tropical storms and hurricanes?
The RTFS starts modelling a storm and producing information as soon as the NHC issues its first advisory for a storm. This usually happens when a system strengthens into a tropical storm. Until then, we would not get the feed on the system within the RTFS
- Does the RTFS address strong tropical waves which give lots of trouble e.g. the one in Oct 26, 1996 that caused lost lives in Saint Lucia and extensive damages?
Strong tropical waves can give quite a bit of trouble. The RTFS system can only operate from when the system becomes an actual storm because that is when NHC starts to provide the richness of data required to feed into RTFS. It is certainly something that we have been working on. For example the tool which we have been working with CIMH to develop will be able to pick up the rainfall generated by systems which might not be storms but can still cause severe damage. Right now we only have that instrument available to Haiti but it is expected to be extended to other countries soon.
What we will suggest is using the MM5 and WRF models. While they will not provide an outlook in terms of hazards, in terms of the modelling they will give you a fair idea of the wind speeds and approximate precipitation expected with the events. We know that this has been a concern throughout the existence of the RTFS so this is where, in collaboration with the local and regional meteorologists and the now-developing meso-scale models we can actually attempt to cover these issues. CIMH is taking the lead on this and is trying to identify different models that may handle events other than tropical storms.
- How different are the CCRIF RTFS products compared to the NHC products?
RTFS provides additional information to that provided by the NHC. This includes wind, wave, storm surge footprints, impacts on airports, ports and building damage estimates. All of these estimates are based on the NHC forecasted tracks. The RTFS therefore provides additional information in support of the NHC forecasts. Outputs are consistent with NHC outputs and go beyond, as much information is produced which NHC does not provide; e.g. the impact forecasts and also the real time storm surge footprints. Therefore we encourage users to use the NHC forecast for what it has and use the RTFS for what it adds. In addition, the flexible visualisation aspect of the RTFS in Google Earth can be a useful tool.
- Why was Barbados rainfall not captured in your analysis, given that we recorded over 300mm in the passage of Tomas?
The Barbados rainfall was not captured in the analysis because the RTFS shows rainfall but does not predict or forecast rainfall data.
The post-event run provided during the training session was of a period in which the storm had passed Barbados and hence it would not have captured the approximately 300mm referenced. The simulation would have to be rerun starting at a point before the system had reached Barbados to then determine what the rainfall estimates would have been for Barbados.
- What are the differences between NHC and RTFS outputs?
The main differences are listed below. The document TC GIS data comparison: NHC and Kinetic Analysis RTFS provides additional details.
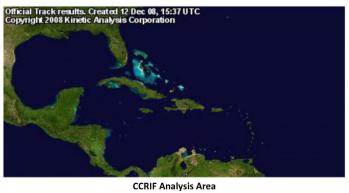
• NHC products are available for storms in the Atlantic and Eastern Pacific basins; the CCRIF RTFS covers storms in the CCRIF Analysis Area (as shown in map below), which encompasses all CCRIF countries.
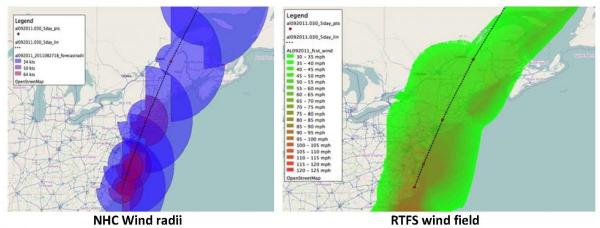
• NHC forecasts wind radii for forecast points but the RTFS models continuous wind field as shown below.
• The NHC does not provide access to all tracks. Past track and current forecast tracks for all model forecasts are available in the RTFS.
• NHC does not produce rainfall forecasts; the RTFS provides storm-generated cumulative rainfall over storm forecast area.
- Does the NHC have storm surge models?
Yes – but only for US territories. Deterministic SLOSH (Sea, Lake, and Overland Surges from Hurricanes) model results are based upon the official forecast track. CCRIF’s RTFS provides deterministic storm surge model results for all Caribbean countries that accounts for asymmetry and wave set up on a common vertical datum for all Caribbean territories. The horizontal (WGS84) and vertical reference datum (tidal mean sea level) are consistent for storm surge results.
- What do the RTFS earthquake outputs show?
The earthquake outputs are not forecasts – it is not possible to forecast earthquake impacts – but are estimated impacts. They are direct translations of certain earthquake characteristics into a hazard footprint – to simulate the expected impacts on a particular territory from a given earthquake. The RTFS earthquake outputs show the ground acceleration footprint (in %g) and the population affected by level of intensity, using the Modified Mercalli Index (MMI).
- Are there any active projects initiating crowd sourcing of information for the Dewetra platform?
There is a feature which allows people with smart phones to forward reports and photos to the Dewetra platform. CDEMA intends to work with CIMH to customise Dewetra. We intend to maximise use of the system and improve disaster management in the region, even if it requires extra resources. Note that work is being done to integrate the CCRIF RTFS on the Dewetra platform. This will enhance the Dewetra platform, for example by making available the storm surge modeling which currently is not available on Dewetra.
- How can someone gain access to the Dewetra platform?
Send a request to Ms Adanna Robertson-Quimby at CIMH through Kathy Ann Caesar (kacaesar@cimh.edu.bb) – she will pass it on. The platform is available via the CIMH website (www.cimh.edu.bb) CIMH conducts training on the Dewetra platform. They have conducted training only with the initial countries which were involved but they will be expanding training to all regional states and will be inviting other persons in the future. If interested, contact Ms Quimby (arobertson@cimh.edu.bb)
- Is there any integration of these systems with WebEOC?
WebEOC and Dewetra have similar features but they are not compatible. In the Caribbean, there are many different software tools available. CDEMA is in the process of conducting an analysis to determine which tools are the best to meet the region’s needs for the next 5-10 years. WebEOC is one of the systems that is being analysed.
Briefings and Use of RTFS Outputs
- Are we allowed to use the information in our media briefs and quote the source of the information?
By all means users can use the information. Users can do a screen capture to capture the image of a hazard footprint or an impact table and share that with media. The source should be quoted, i.e. that the information comes from the CCRIF RTFS and that it is a best estimate. It is important to note that if it is the estimate based on a forecast of a system that is still 24 or 36 hours out, you have to include a warning that this is based on a forecast and that it will change as the storm track changes while the storm approaches. We all know that tracks and intensity change as the storm approaches. So the information definitely can be shared but it has to be put in context in terms of the uncertainty.
- It would be good for NMHS to be briefed on this information as well.
Yes it would. CCRIF will include the emails of those who are interested in receiving these bulletins in its mailing list.
- Where and how often can I retrieve this information- I understand it is provided to the disaster management agencies- can it be provided to the NMHS as well?
TAOS RTFS information can be accessed using the password were given for training which is the same as for the CCRIF website secure area. The briefings produced by CIMH for CDEMA can be made available to persons once they indicate to CIMH that they would want to be included on CIMH’s mailing list.
COMMENT from P. Mullin (Disaster manager): “All of this info is good but I will be talking to my met office before taking any final action”
This in indeed correct and exactly what we were trying to put forward The local meteorological service is responsible for taking the broad information provided through the NHC forecasts and adapting it to local conditions. Given that the RTFS is also available to local meteorological services, we hope that they will incorporate useful information from RTFS into their local information packages.
- What is the timeframe in which this briefing is provided?
As soon as the NHC releases the latest bulletin on the system, an appropriate briefing is put together with the aid of RTFS model outputs.
- In case of Tomas last year, the first bulletin from NHC came out at 2100UTC; at what time was the first briefing given to CDEMA? I am trying to ascertain if it can be given to an NMHS in real time.
The first bulletin to CDEMA was prepared at 10 a.m. or 1400UTC that morning because we anticipated an impending problem/situation. At that time we did not have the RTFS models but we had both the MM5 and WRF so we used those.
- Also what is the mode of dissemination?
By email, or if required, briefings may be given over the phone; it is possible for us to give a live briefing at the CDEMA offices.
- Do you provide briefing on the intensification shown in the MM5/WRF models that CIMH is running?
Yes. With Tomas, we saw intensification changes in that the system. Initially, it appeared that the system may have intensified to a storm. We cannot call it a tropical cyclone, we can only say that the system may intensify to a tropical cyclone and then when NHC does the upgrade then we will go from there. Also, if the system seems to be weakening we also advise and give suggestions. We would base this on the models and also would look and use our own know-how in terms of the satellite imagery, the current synoptic situation and what may be causing the system to dissipate when we give our advice.
- How do persons who are not in meteorology or disaster management offices, for example in planning agencies, access CIMH weather reports?
CIMH sends the reports to CDEMA which then disseminates them throughout the region. Any person who wishes to be on CIMH’s mailing list should send a short letter with the email address to CIMH Director, Dr. David Farrell (dfarrell@cimh.edu.bb). CIMH wishes to be careful about spreading the reports too widely and prefers for people to get the information through regional or national weather services. CIMH plays an advisory role in the background.
[1] LANDSCAN: compiled by the US Oak Ridge National Laboratory’s Global Population Project (– http://www.ornl.gov/sci/landscan)
[2] Geostationary Operational Environmental Satellite (GOES)/ Polar Operational Environmental Satellite
[3] The SLOSH model is a computerised numerical model developed by the US National Weather Service to estimate storm surge heights resulting from historical, hypothetical, or predicted hurricanes by taking into account the atmospheric pressure, size, forward speed, and track data. These parameters are used to create a model of the wind field which drives the storm surge. (www.nhc.noaa.gov/surge/slosh.php)